Back
Deployment 03
Knowing the Impact of Every Change Before It Breaks
How an engineering organization gained real-time visibility into downstream impact across services, tests, and releases.
250 engineers · microservices architecture · high deployment frequency · 4-month rollout
01
Discovery
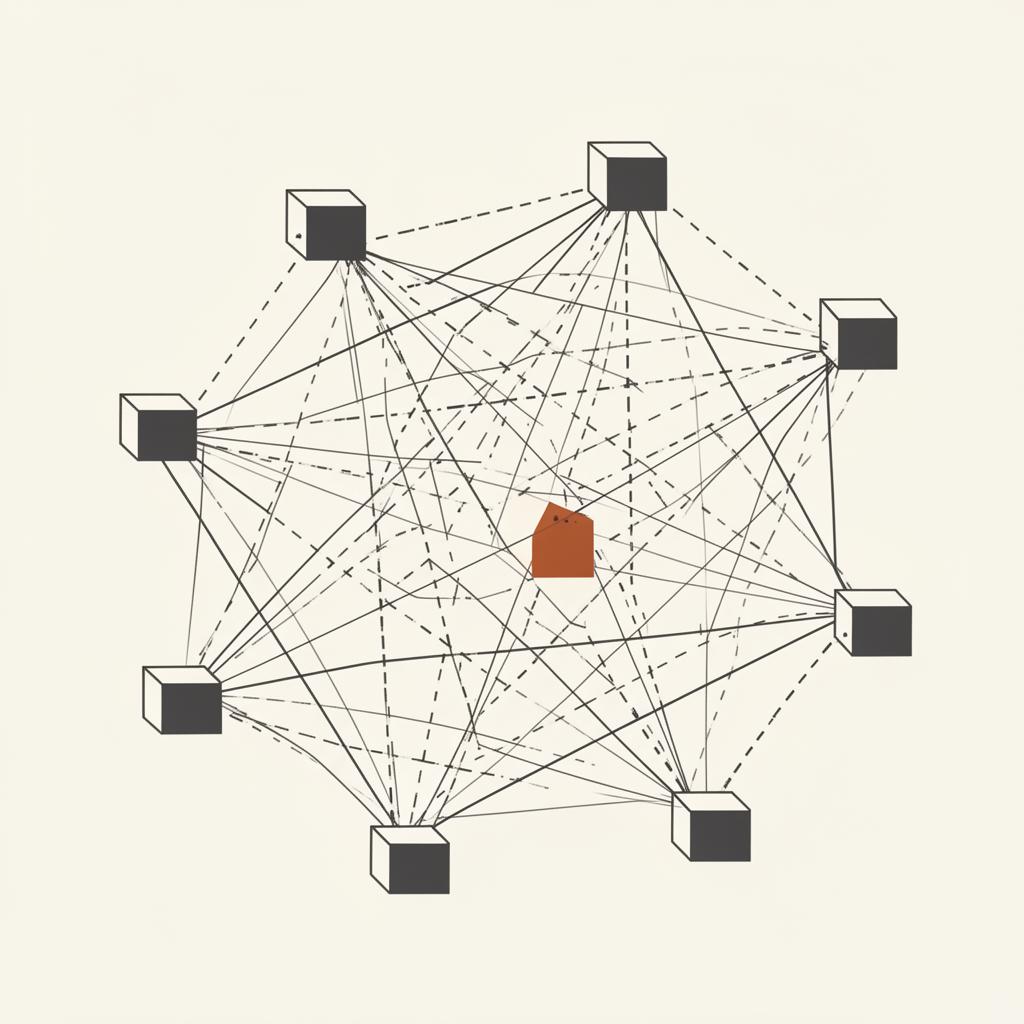
Why Changes Failed Late
Teams lacked visibility into how changes propagated across the system until failures surfaced.
Challenges
- Unknown dependencies
- Late integration failures
- Incomplete test visibility
Signals
- Frequent production issues
- High rollback rates
- Release failures
Where Time Was Lost
- Debugging production issues
- Emergency fixes
- Release delays
Opportunity Map
| Workflow | Priority | Impact |
|---|---|---|
| Dependency Mapping | High | Improve visibility |
| Impact Prediction | High | Prevent failures |
| Release Risk Detection | High | Increase confidence |
02
Setup
Building a Live Map of the System
Cubyts created a real-time SDLC context graph connecting services, tests, and releases.
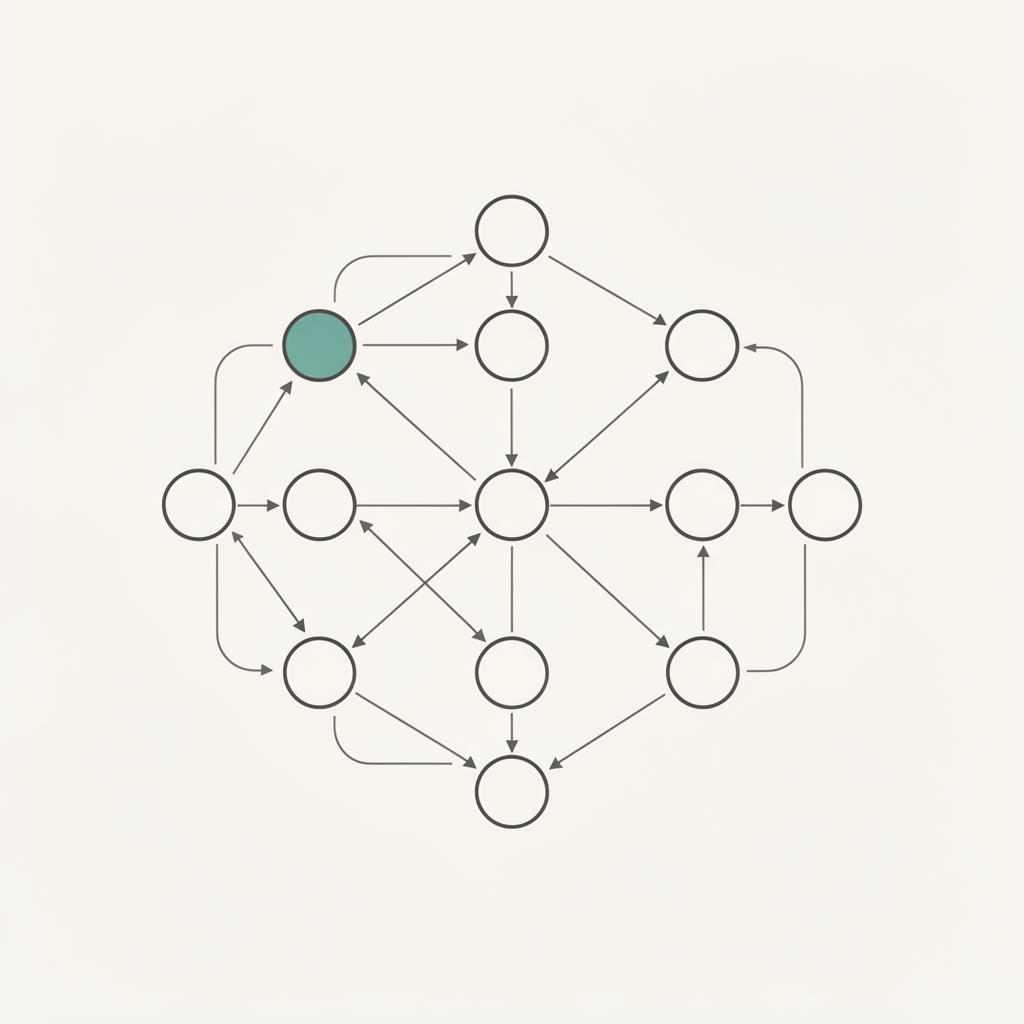
Context Graph
- Service dependencies
- API relationships
- Test coverage
- Release pipelines
Integration
- Git, CI/CD, testing tools
- Continuous updates
Configuration
- Risk thresholds
- Impact rules
- Release gates
Rollout
- Phased across services
- No process disruption
- Continuous calibration
03
Team Views
What Teams Could Finally See
Every change was now visible in terms of its downstream impact before it was merged or released.

Developer View
- Impact radius
- Affected systems
QA View
- Coverage gaps
- Risk areas
Release View
- Readiness signals
- Risk indicators
Leadership View
- Predictable releases
- Lower production risk
- Confidence at sign-off
04
Under the Hood
Predicting Risk Before It Materializes
Cubyts analyzes dependencies and change patterns to predict downstream impact in real time.

Flow
- 1.Change detected
- 2.Dependencies analyzed
- 3.Impact predicted
- 4.Risks flagged
Capabilities
- Real-time analysis
- Risk scoring
- Impact visualization
Signals Tracked
- Schema and API changes
- Service-to-service dependencies
- Test and release coverage
Alerting
- Routed to owners
- Surfaced at PR time
- Release gates enforced
05
Outcomes
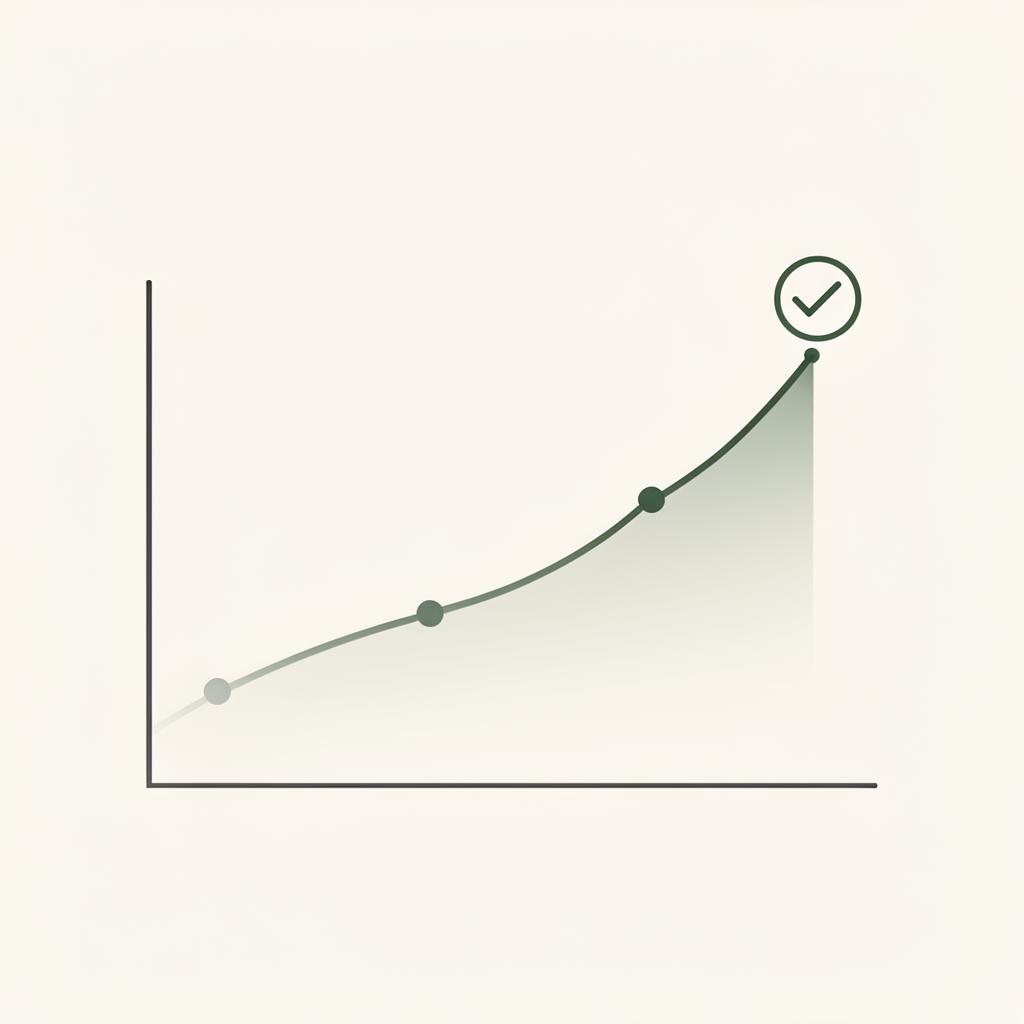
From Reactive Fixes to Confident Releases
Teams moved from discovering issues late to preventing them early.
| Metric | Before | After |
|---|---|---|
| Production Incidents | High | ↓ 35% |
| Release Failures | Frequent | Rare |
| Rollback Rate | High | Reduced |
| Release Confidence | Low | High |